

Z-Score#
The Z-Score detrending is a standard score that measures the number of standard deviations a data point is from the mean. It is calculated as:
where \(X\) is the data point, \(\mu\) is the mean, and \(\sigma\) is the standard deviation.
from delaynet.detrending_methods import z_score
# Apply Z-Score detrending
detrended_ts = z_score(time_series)
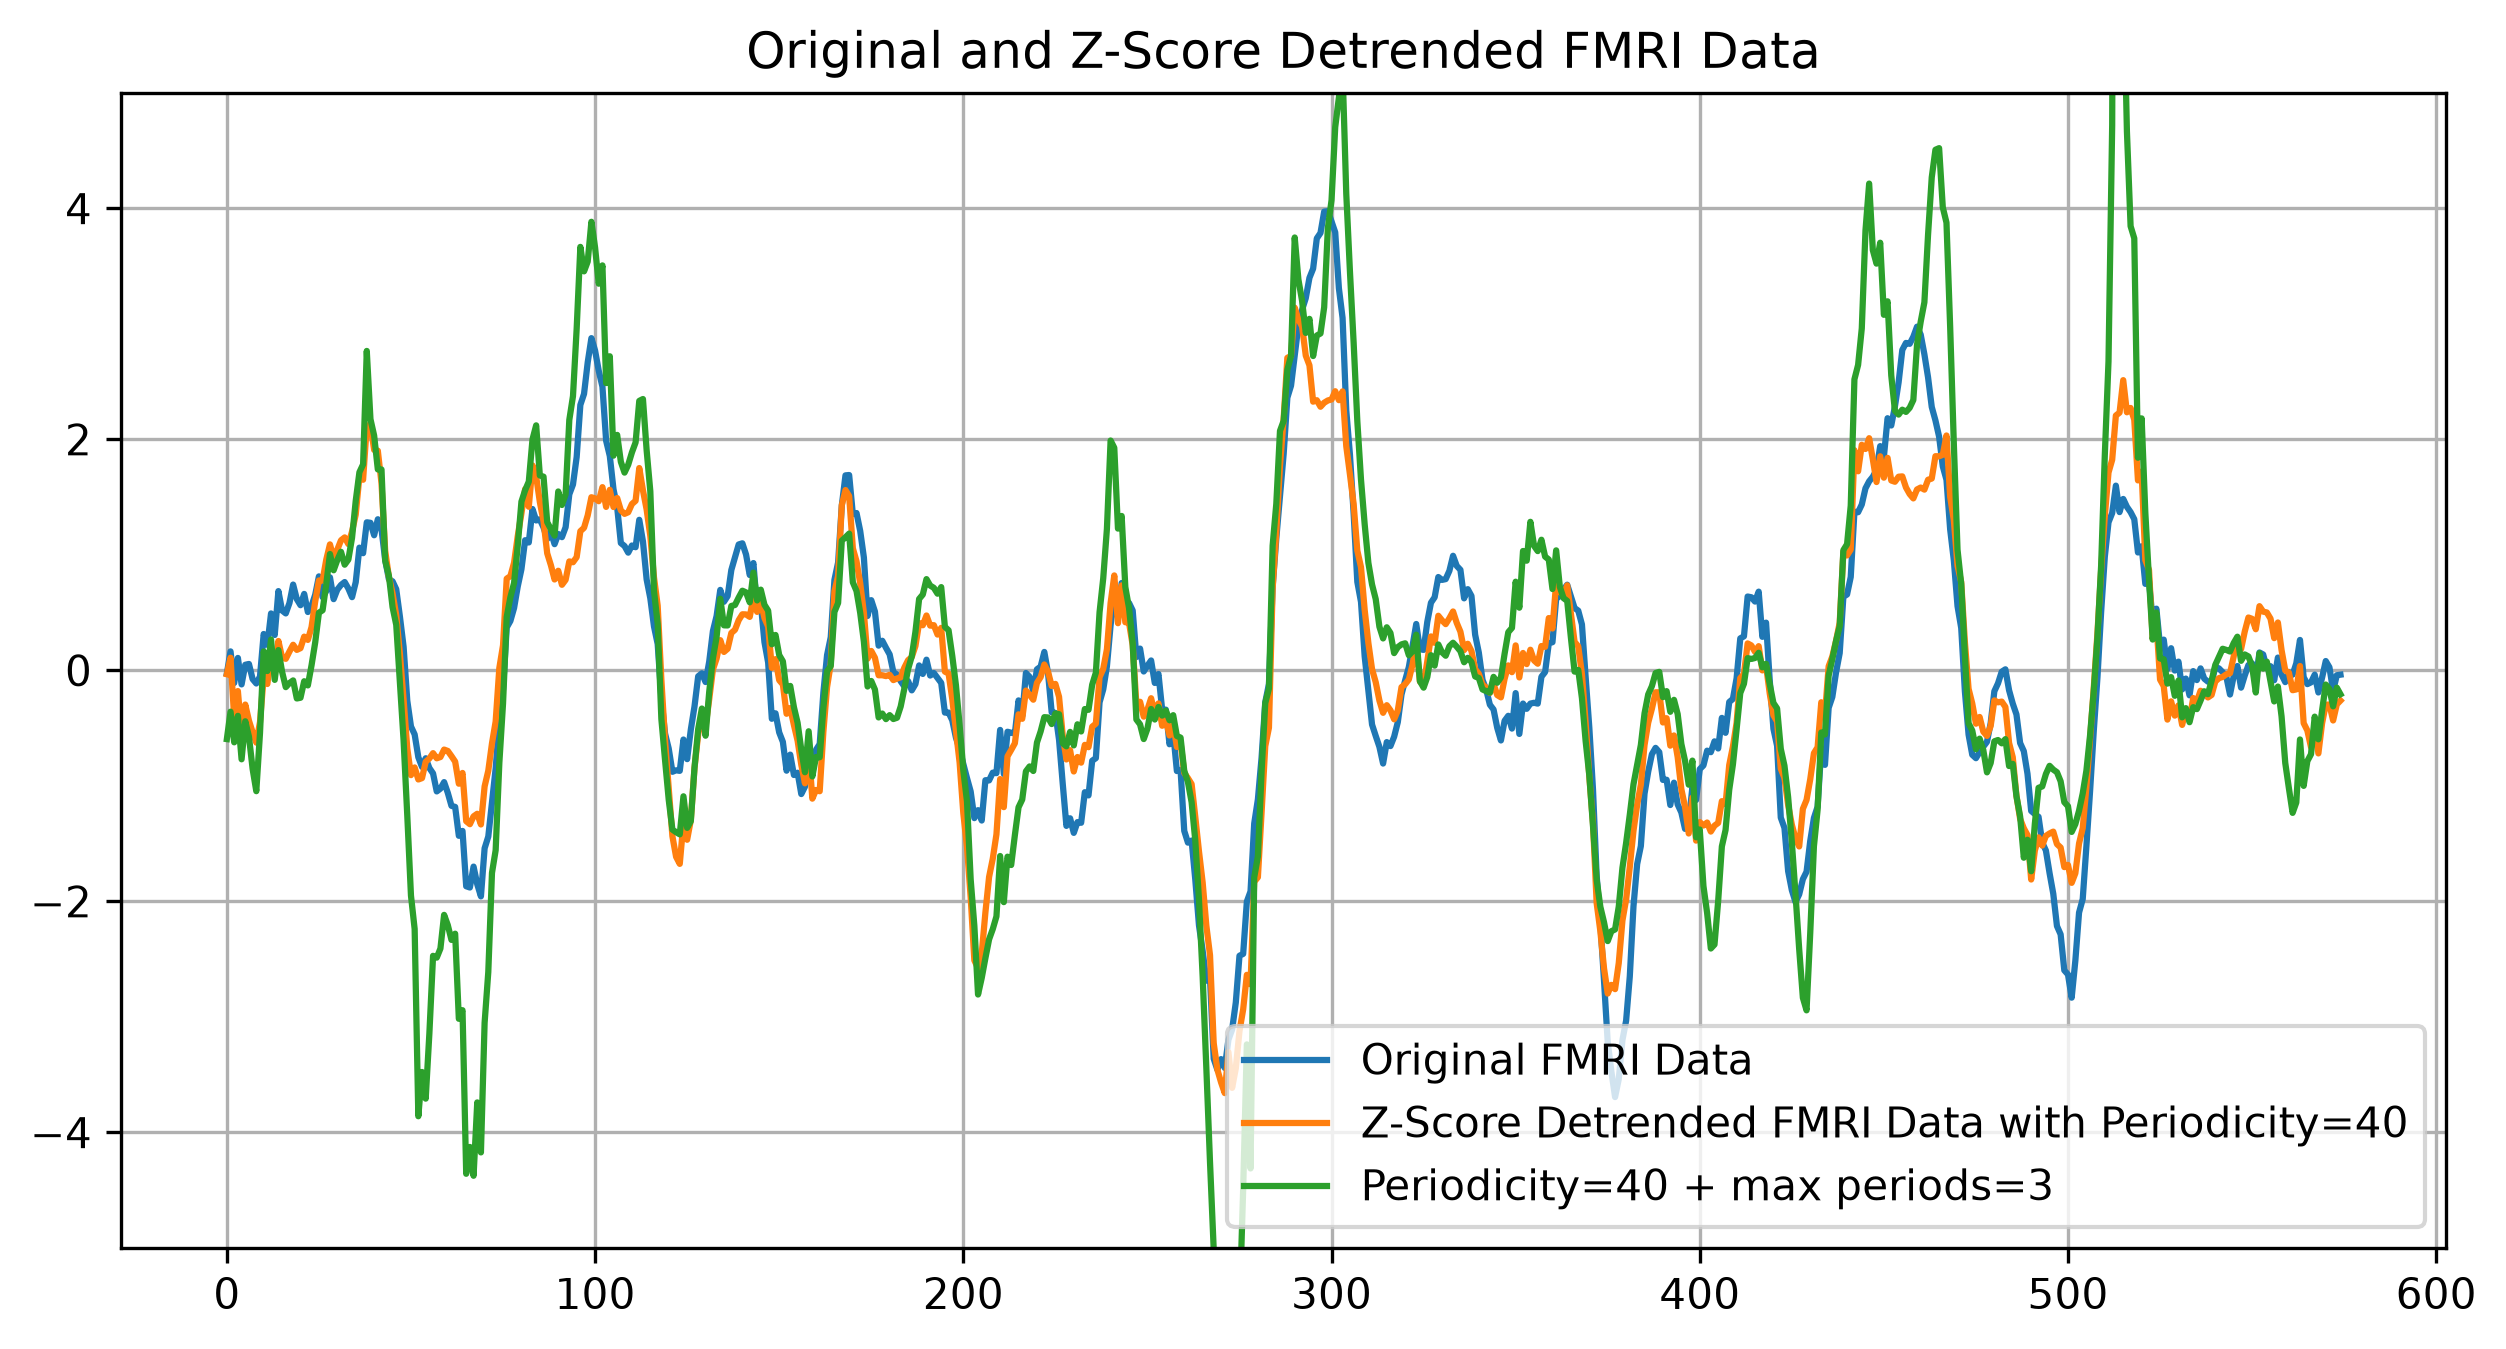
# Apply Z-Score detrending with periodicity
detrended_ts = z_score(time_series, periodicity=24, max_periods=7)
The Z-Score detrending in delaynet can take into account the periodicity of the time series. This is useful for data with seasonal patterns, such as daily or weekly cycles. The periodicity parameter specifies the number of time steps in one period, and the max_periods parameter limits the number of periods to consider before and after the current value.
- detrending_methods.z_score(periodicity: int = 1, max_periods: int = -1) ndarray
Z-Score (ZS) detrending.
The Z-Score (ZS) detrending is a standard score that measures the number of standard deviations a data point is from the mean. It is calculated as:
\[Z = \frac{X - \mu}{\sigma}\]where \(X\) is the data point, \(\mu\) is the mean, and \(\sigma\) is the standard deviation.
The Z-Score detrending is applied to a time series by computing the mean and standard deviation of a sub time series around each data point. The sub time series is defined by the periodicity and the maximum number of periods to consider before and after the current value. Mean and standard deviation are computed for each sub time series and used to detrend the data point. The current value is removed from the sub time series to avoid bias.
When
periodicity > 1, the function compares each point with other points at the same phase of the cycle (same position within each period).When
periodicity == 1:If
max_periods == -1, a simple Z-score is applied to the entire time series.If
max_periods != -1, a moving window approach is used, where each point is compared withmax_periodspoints before and after it.
For a valid Z-Score, \(2\times\texttt{periodicity}+1 \leq \texttt{len(ts)}\) needs to be satisfied. Also, \(\texttt{max_periods} \times \texttt{periodicity} \geq\texttt{len(ts)}\) results in including all periods.
- Parameters:
ts (numpy.ndarray) – Time series to detrend.
periodicity (int > 0) – Periodicity of the time series - reoccurrence of the same pattern.
max_periods (int >= -1) – Maximum number of periods to consider before and after the current value. If -1, all periods are considered.
- Returns:
Detrended time series.
- Return type:
- Raises:
ValueError – If the
periodicityis not a positive integer.ValueError – If the
max_periodsis not a positive integer or -1.ValueError – If \(2\times\texttt{periodicity}+1 \leq \texttt{len(ts)}\) is not satisfied.