

Delta Detrending#
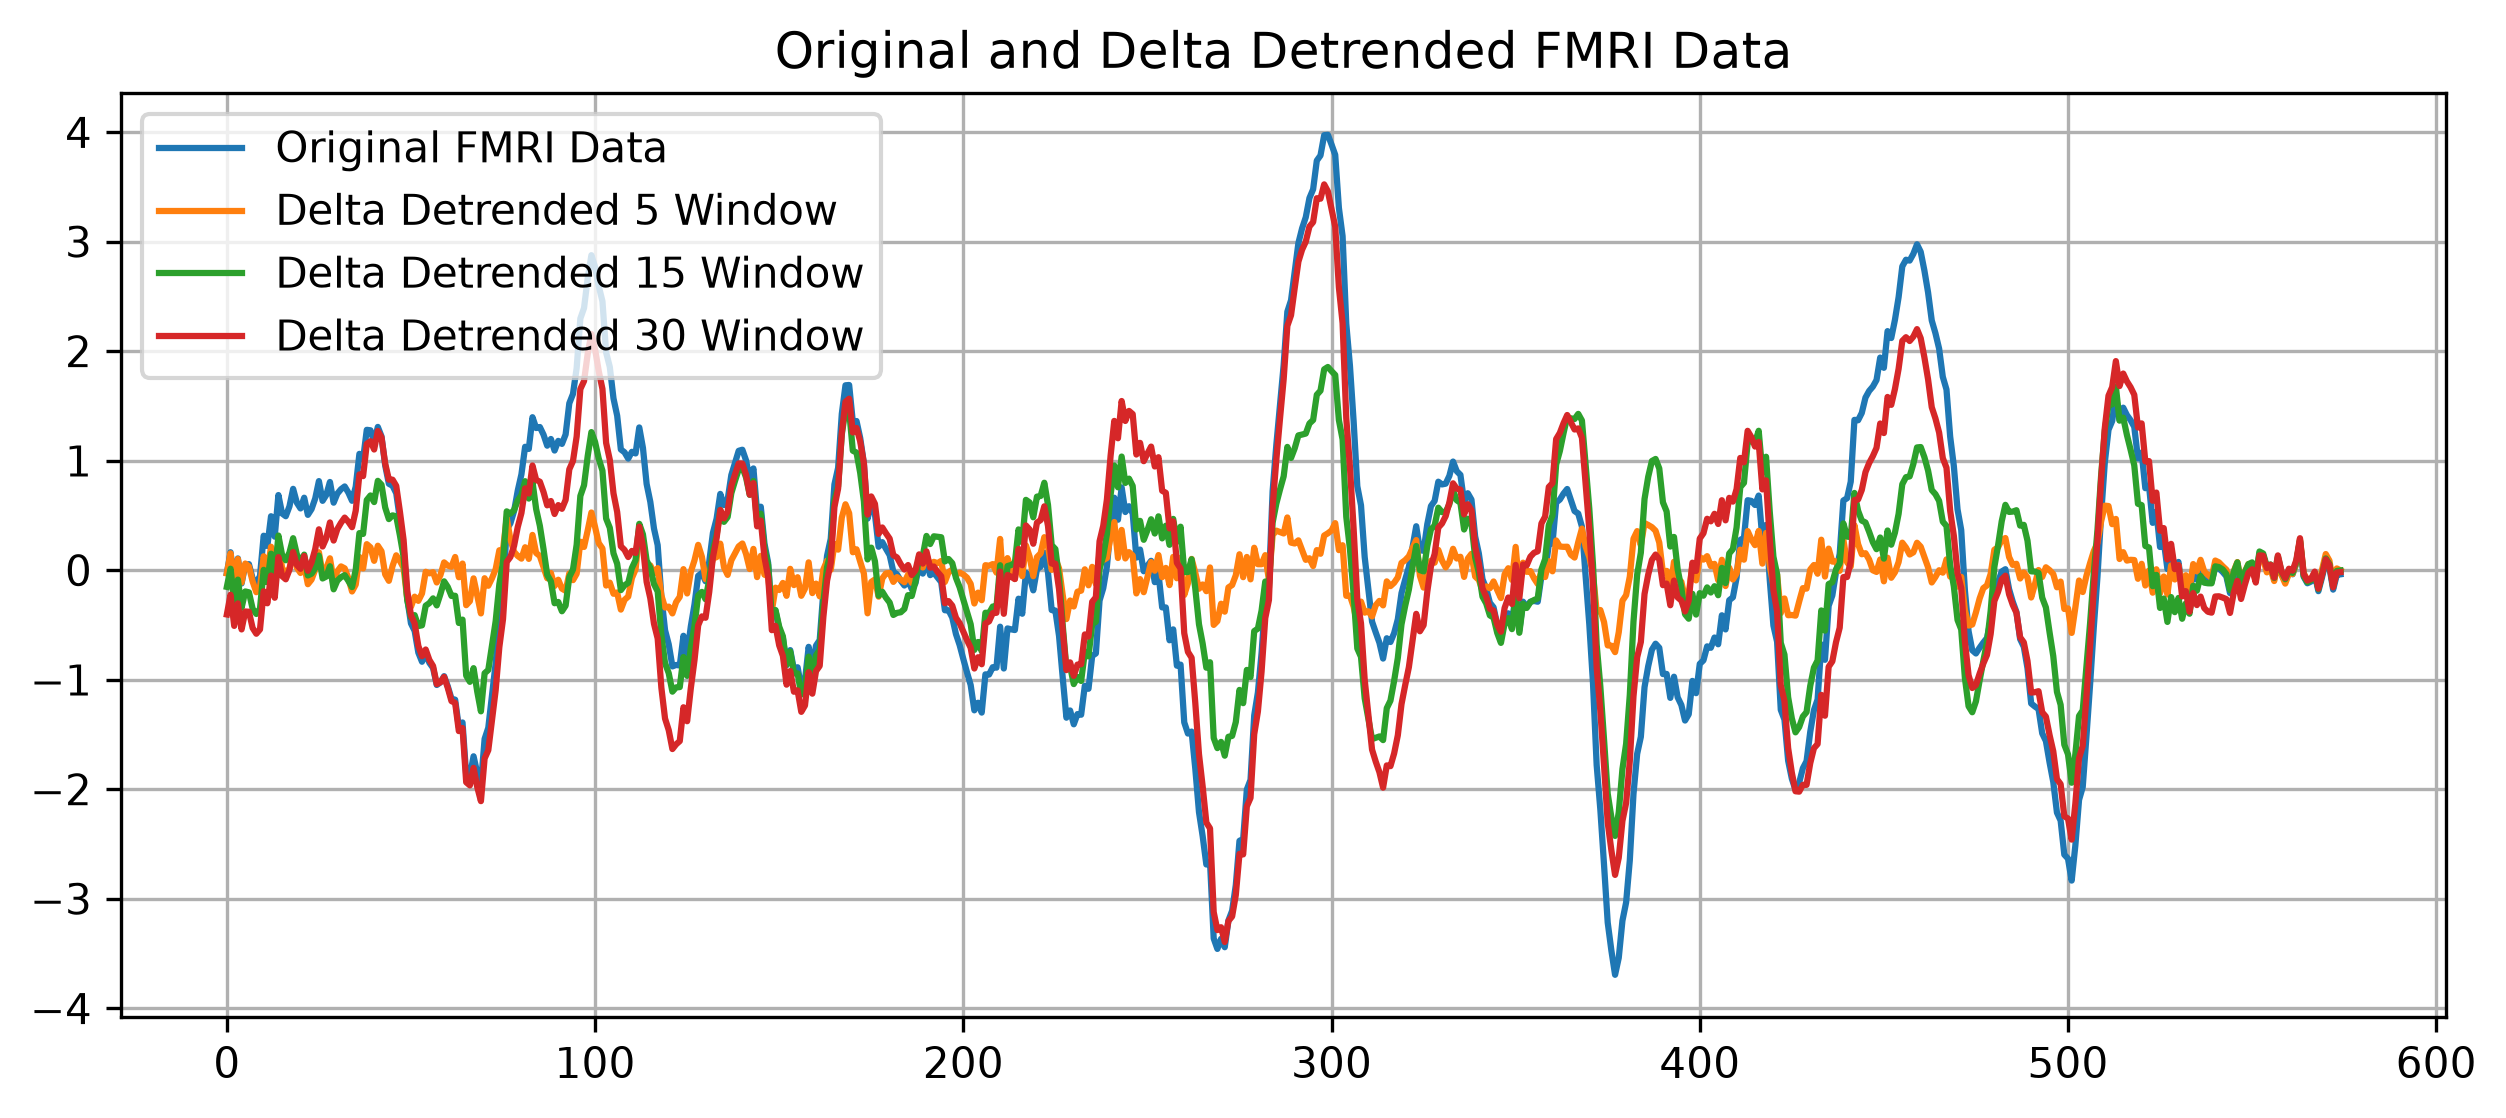
The delta detrending method performs local mean subtraction. For each value in the time series, it subtracts the mean of a window of values centered around that point. (CITE)
from delaynet.detrending_methods import delta

# Apply delta detrending with a window size of 10
detrended_ts = delta(time_series, window_size=10)
Mathematically, the delta detrending is defined as:
\[x_t' = x_t - \frac{1}{2w + 1} \sum_{k = t - w}^{t + w} x_k\]
where \(x_t\) is the value at time \(t\), \(w\) is the window size, and \(x_t'\) is the detrended value.
- detrending_methods.delta(window_size: int = 10)
Delta detrending.
Local mean subtraction. Subtract the local mean, mean([x_{t - w}, …, x_{t + w}]), from each value x_t.
\[x_t' = x_t - \left(2w + 1\right)^{-1} \sum_{k = t - w}^{t + w} x_k\]- Parameters:
ts (numpy.ndarray) – Time series to detrend.
window_size (int) – Window size to use for calculating the mean. Must be a positive integer.
- Returns:
Detrended time series.
- Return type:
- Raises:
ValueError – If the window_size is not a positive integer.